Getting Started with R and R Studio
A walkthrough of beginning with the R programming language
by Evan Horsley
(as of 16-DEC-2019)
R is an open source language and environment for statistical computing and graphics.
Here at IEL, we deal with very large sets of data every single day. R is a powerful programming language for handling this data and breaking it down in new ways. Many people prefer Python and its packages like Pandas to deal with these large sets of data. There are a few drawbacks to using Python to handle this data, however, including the lack of a GUI and a worse off ecosystem (fewer packages, smaller community, etc), just to name a few.
Many people that write in R use R Studio. You can find free and paid versions of R Studio Here.
This post will take you through my experience step by step getting R and R studio setup on my machine. It will also cover how I wrote my first R script, and how you can too!
Part One - Install 💿
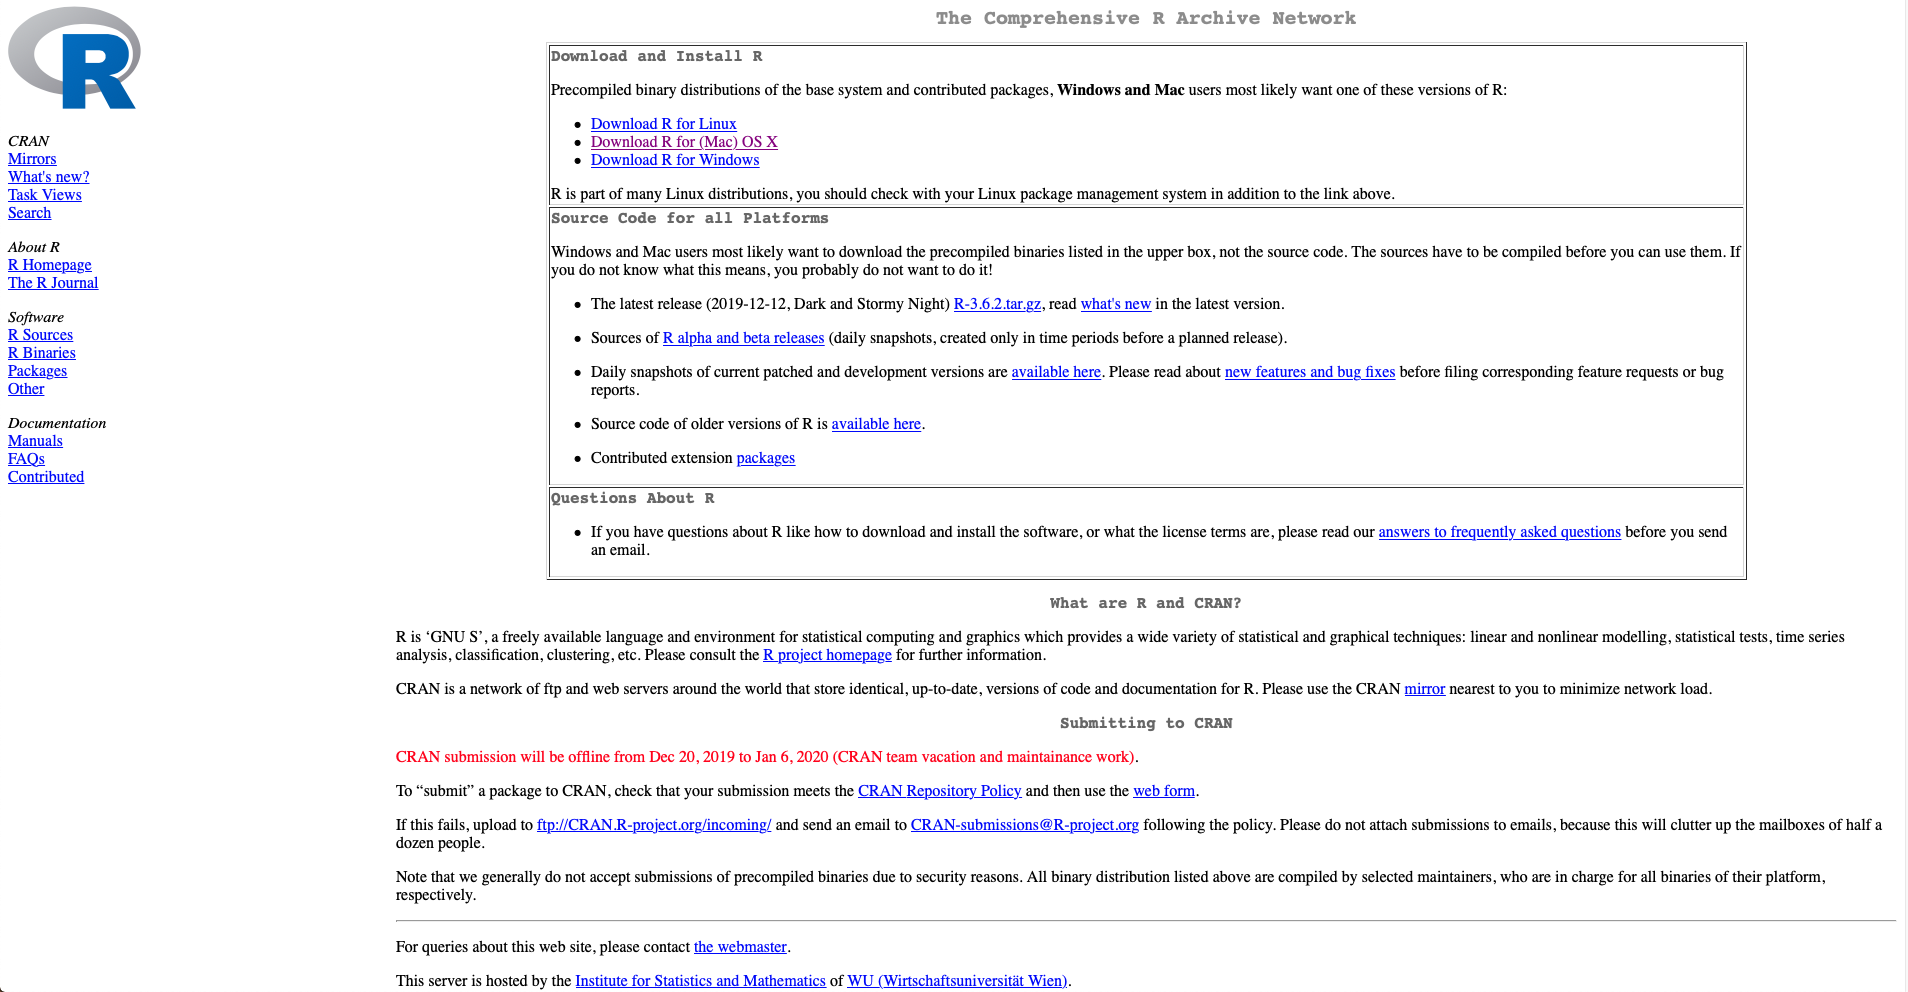
First, we’ll need to download R from the CRAN (Comprehensive R Archive Network). I will be installing on macOS, but you should download the package that corresponds with your operating system. After that, follow the prompts to install R on your machine.
After this we can launch R through the R console that just installed onto our machine. While the console is nice, the GUI of R Studio is much better to work with, especially when dealing with large sets of data. Plus, if you’re anything like me, seeing things visually always helps me understand them better. Let’s begin installing R Studio. Head on over to the link Here to download R Studio. As mentioned earlier, there are free and paid versions, but the free version will work fine for most tasks.
Follow the prompts on screen and complete the install.
Part Two - Getting Familiar 📖
Now that we have R and R Studio installed, let’s look around to get familiar with the interface of R Studio. On first launch we will see:
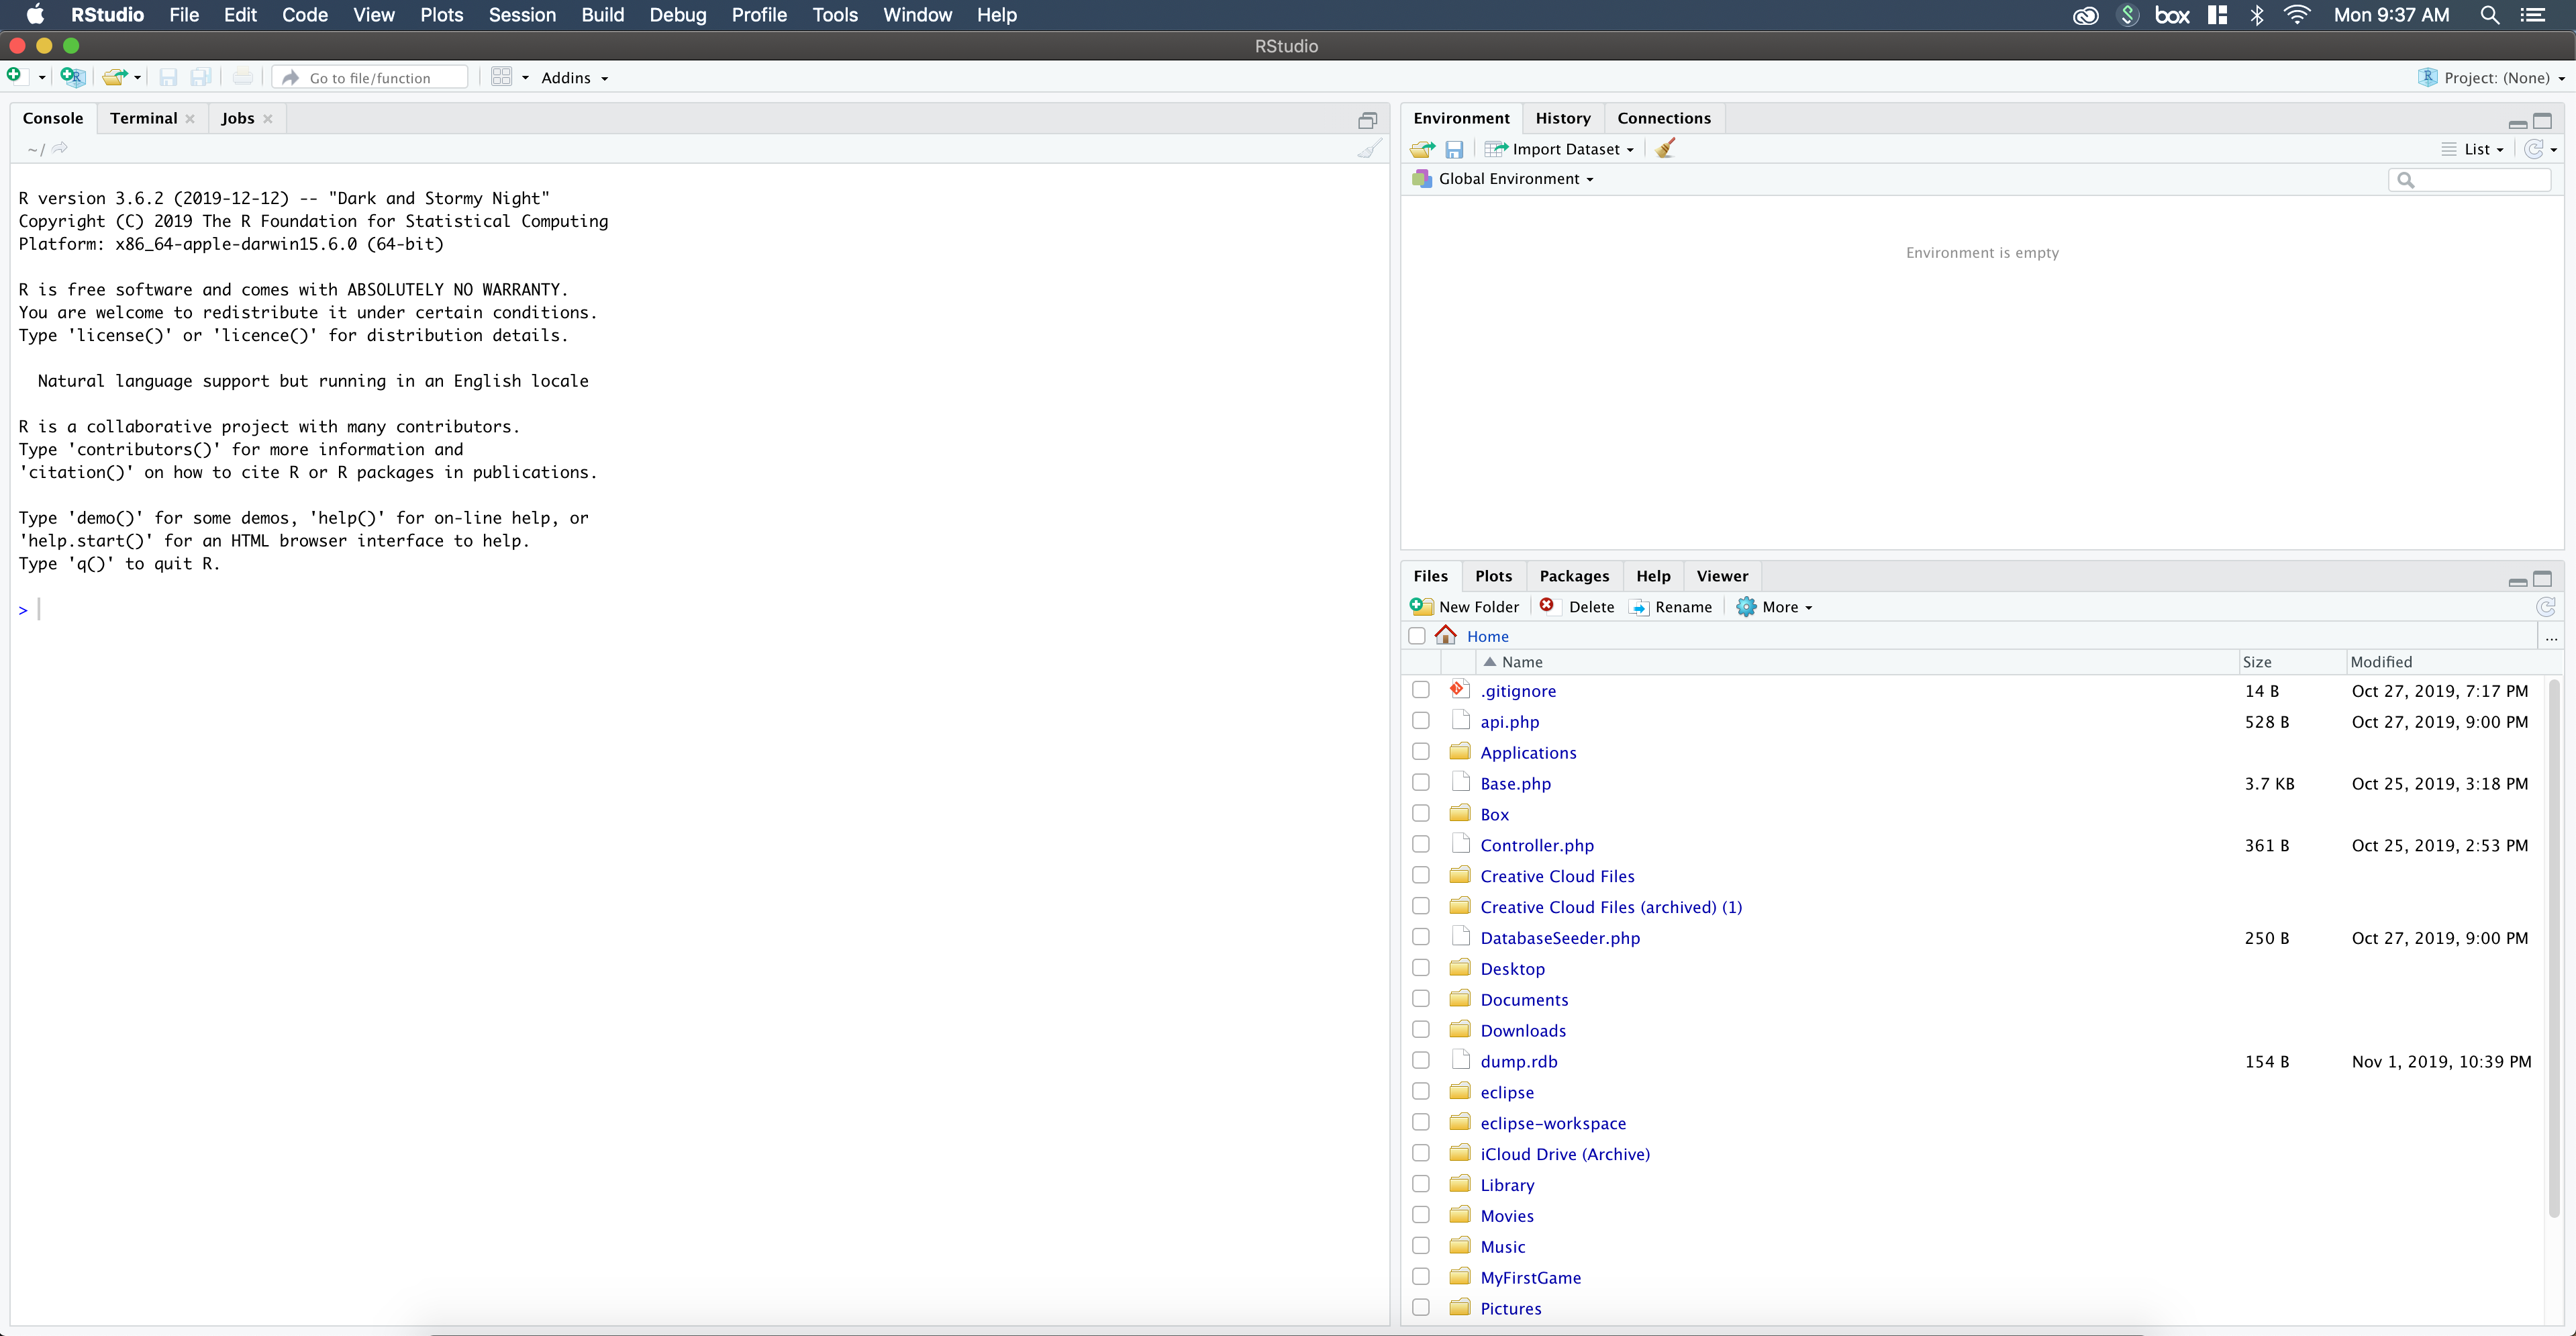
- Left: Console - This is the exact same console from the R console we launched earlier. There is also a tab with a local running terminal on our machine, as well as a jobs tab to show currently running (and previous) jobs.
- Top Right: Environment - This area houses all of our data sets and variables currently stored in our current R working directory. It will also show a tab with history of previously used commands, as well as a connections tab for connecting to external sources for data.
- Bottom Right: Display - This section contains a file explorer, as well as a tab to see all of our plots, R packages that we’re utilizing, and even a nice Help tab to find more documentation regarding R and R Studio. There is also a viewer tab for viewing local web content.
Part Three - Our First Script ✏️
To begin writing our first script in R, go to the top left and click the New icon, and from that drop-down select R Script. This will slide the console on the left downwards, and then show an editor where we can begin writing our code.
R seems to be very similar to Python. For me, having a fair amount of knowledge on Python makes learning R easier, however if you don’t have experience with Python (or any programming at all), I recommend checking out this book Here. It helped me gain more of an understanding on R itself as well as how to use it to work with sets of data (our end goal!).
We’ll begin our first R script by writing the infamous Hello World program. To do this, we’ll head on over to the editor that popped up before and type:
print("Hello, world!")
Once we’ve done this, we’ll click Run in the top right of our code editor. This should print Hello, World! to the console in the bottom left. Your screen should look like this:
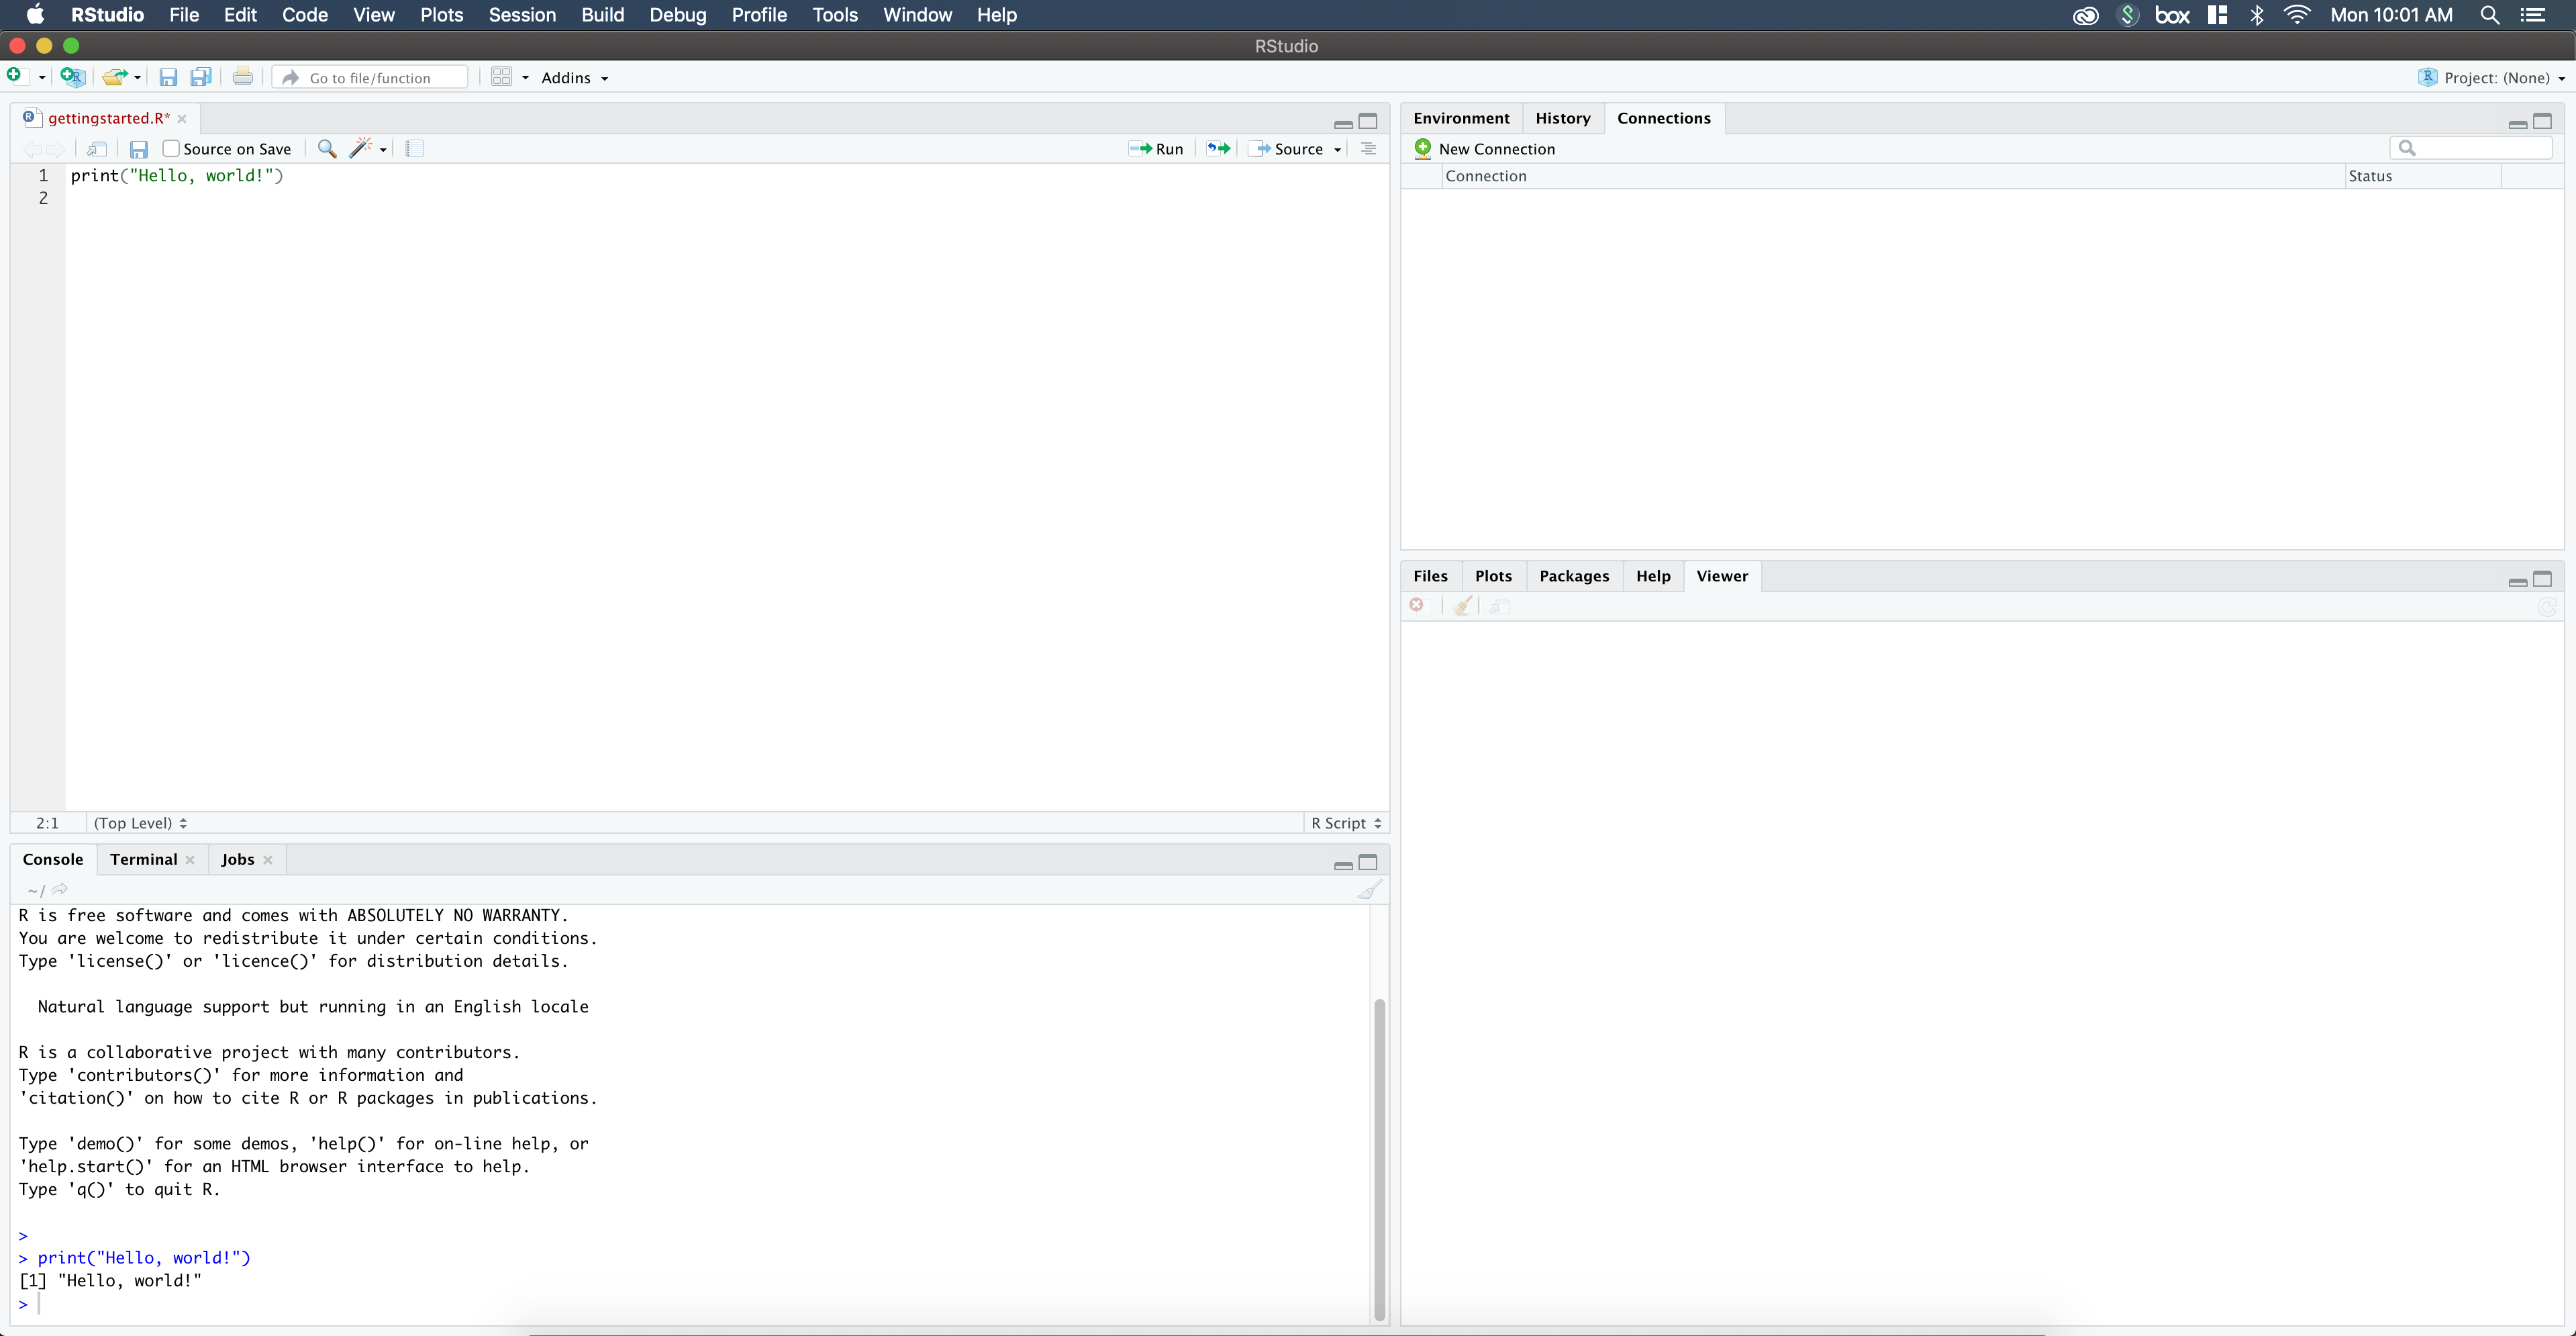
And we did it! We wrote our first script in R. 😎
Part Four - Something A Bit More Advanced 🚀
Now that we have R and R Studio up and running, let’s try something a bit more advanced. The main focus of R is to allow users to programmatically work with very large sets of data (and subsequently be able to do very cool things with them!).
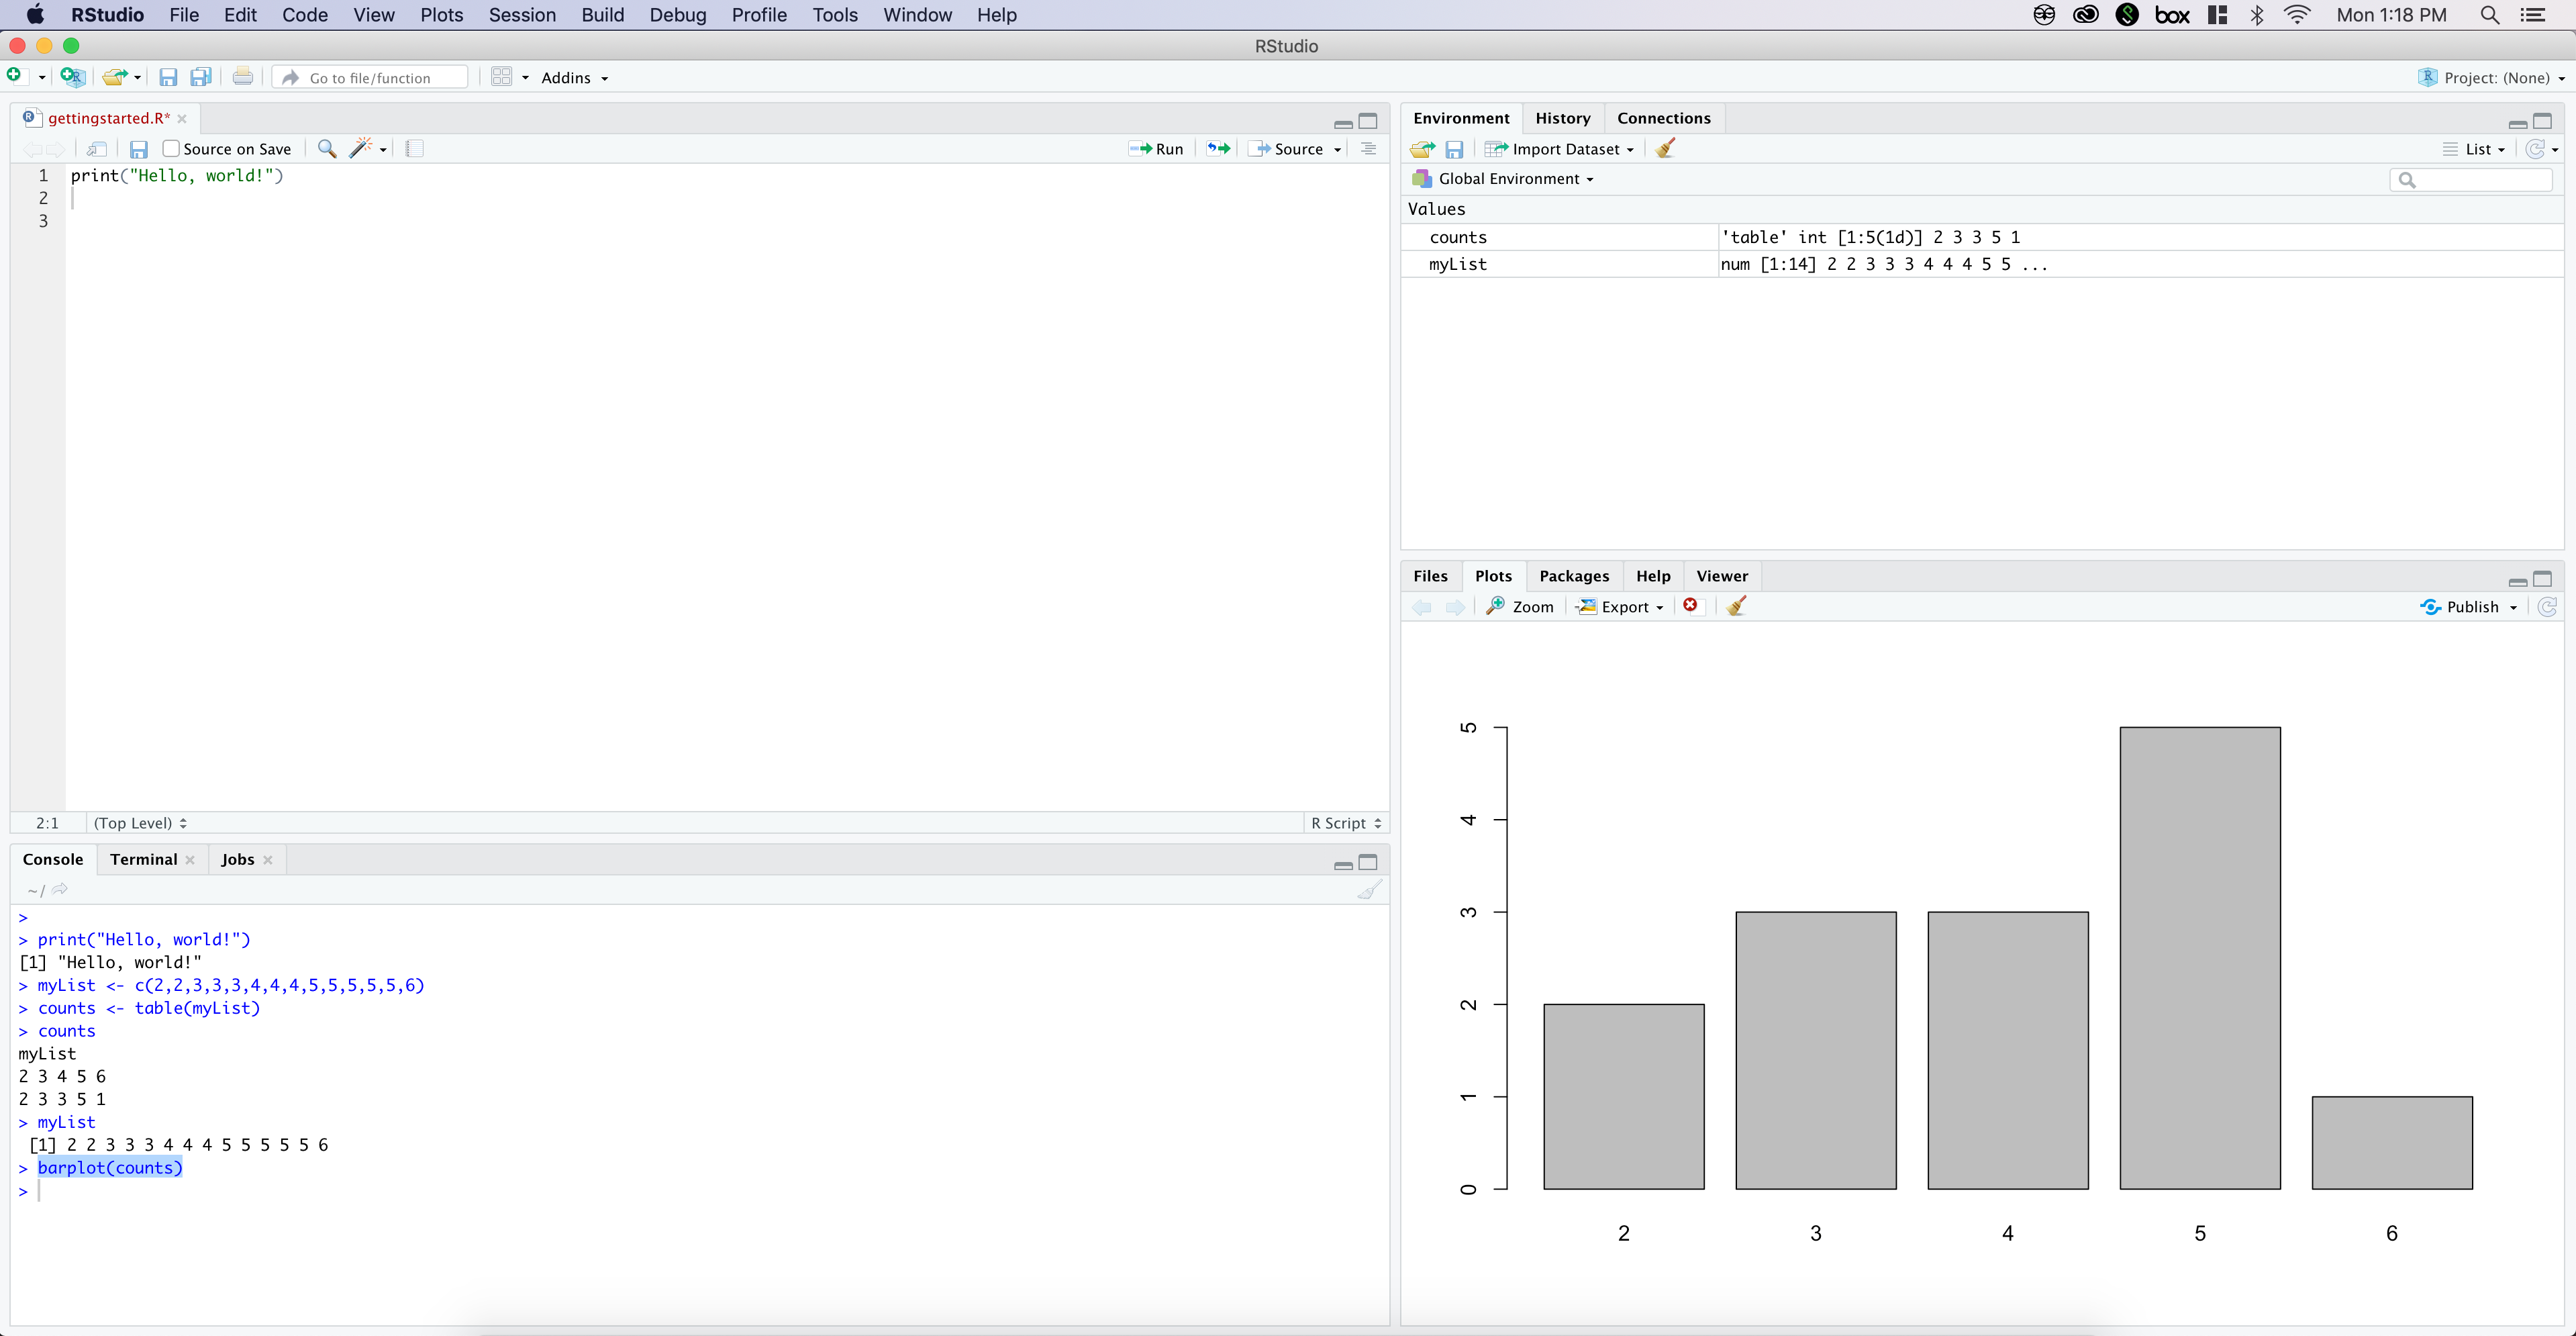
For something more advanced, let’s if we can make a bar graph with random data that we generate. To do this, we’ll enter
myList <- c(2,2,3,3,3,4,4,4,5,5,5,5,5,6)
counts <- table(myList)
counts
myList
barplot(counts)
into the R console (inside of R Studio). Press enter and we should see this:
Here’s what each line of the above does:
Combine arguments to form a vector
myList <- c(2,2,3,3,3,4,4,4,5,5,5,5,5,6)
The first line generates a vector from the values we inserted between the parenthesis. Here, I inserted several integers for this vector, but you can use other types as well.
Generate table from vector
counts <- table(myList)
The table function then takes the vector and forms it into a table which allows for easier manipulation.
Print the counts table
counts
Typing in the name of a variable/value into the console will return that value. This can be helpful to quickly see a formatted version of that variable (such as a table or vector).
Print the myList vector
myList
Just as before, we can quickly view a basic formatted version of a value or variable by typing its name into the console.
Generate a bar plot from our table
barplot(counts)
The bar plot function allows us to create a bar plot from whichever set of data we feed it, in this case our counts table. This bar plot shows us the total number of times each number occurs in our tables, or more specifically in our original vector.
The Power Of R 🔌
As all industries continue to grow, the analytics of data is so much more important to understanding how your company/business functions, as well as how to grow and improve on your existing procedures and ideas. R and R studio allow us to take this data, whether a small or large set, and put it to work. R Studio allows us to visualize the data, manipulate it to draw conclusions, and even implement a bit of machine learning to predict how things will behave in the future. Regardless of how you use R and R Studio, their benefits can be clearly seen across all industries that exist today.